
AI Trading Dashboard: Setup & Daily Use
- HybridTrader Editorial
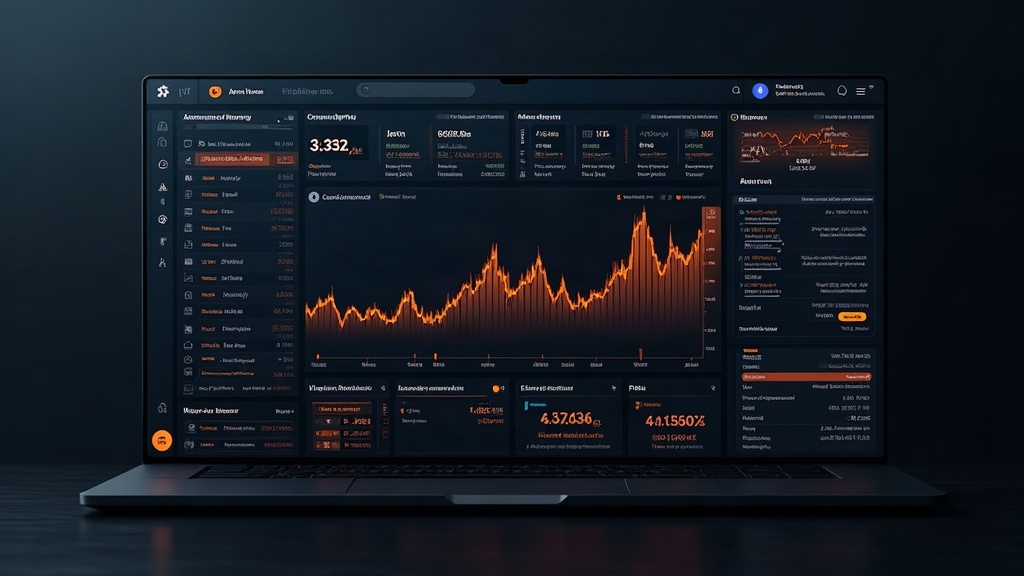
Active traders need a single screen that combines pre-market context, economic events, news, multi-asset signals, with a review of completed trades and the decisions behind them. A working dashboard integrates market data, broker feeds, and a trade journal so that preparation and review happen in one workflow, not across scattered tools. This guide explains what an AI trading dashboard does, what data it requires, how to set it up, and what it cannot tell you about future performance.
Quick answer: Combining market context and trade review
An AI trading dashboard centralizes pre-market briefing and post-trade analysis in one interface. It connects to your broker or trading platform, imports trade records automatically or via CSV upload, and displays market events, technical signals, and trade performance metrics together.
Tools like the AI Macro Desk provide a daily brief on macro events and multi-asset context across FX, indices, and crypto. An AI Psychologist feature analyzes patterns in your recorded trades to flag discipline or decision-making habits worth reviewing. The dashboard itself doesn't execute trades, change positions, or close orders; you stay in control of entries, exits, and risk.
Setup typically involves linking a broker account, configuring data feeds, and organizing screen layouts for your trading style.
The problem it addresses
Active traders face fragmented workflows.
Market research, economic calendars, and pre-market analysis live in one tab or platform. Trade records sit in a journal or spreadsheet. Performance metrics come from broker dashboards. Switching between these tools creates friction, slows review, and makes it harder to spot connections between market conditions and decision quality. A trader might execute a sound process in calm markets but fail to apply the same discipline when volatility spikes, a pattern that only emerges when pre-market context and trade outcomes sit on the same screen.
Without that view, review becomes reactive: traders chase individual losses rather than examining how their decisions shift across different market regimes. An integrated dashboard removes that switching cost and makes deliberate review practical.
What the feature does
An AI trading dashboard performs four core functions.
Aggregates pre-market context. It pulls economic events, live news, and daily market briefs into a single view. The AI Macro Desk turns macro events and multi-asset signals into a clear summary, so traders can grasp the broader environment before trading starts.
Imports and organizes trade records. It syncs completed trades from your broker or prop firm account automatically, or accepts manual CSV uploads with automatic column recognition. A guided three-step upload process skips rows with errors for clean import.
Displays trade performance and psychological patterns. The dashboard shows trade metrics, win rate, average win/loss, risk metrics, and integrates journal entries. The AI Psychologist feature reads patterns in your recorded trades and identifies areas where discipline or decision quality may shift: larger risk-per-trade when confidence is high, or hesitation to cut losses in choppy markets.
Supports MetaTrader 5 and 50 other platforms. The dashboard connects to major brokers and prop firms via broker integration or synchronization, and supports MetaTraker 5 and approximately 50 other trading platforms.
The output is a repeatable workspace. Open the dashboard, review the day's macro context and your trade history from the prior session, execute with that context in mind, then record the trade with its rationale. After market close, return to review outcomes against the conditions they occurred in.
What data it uses
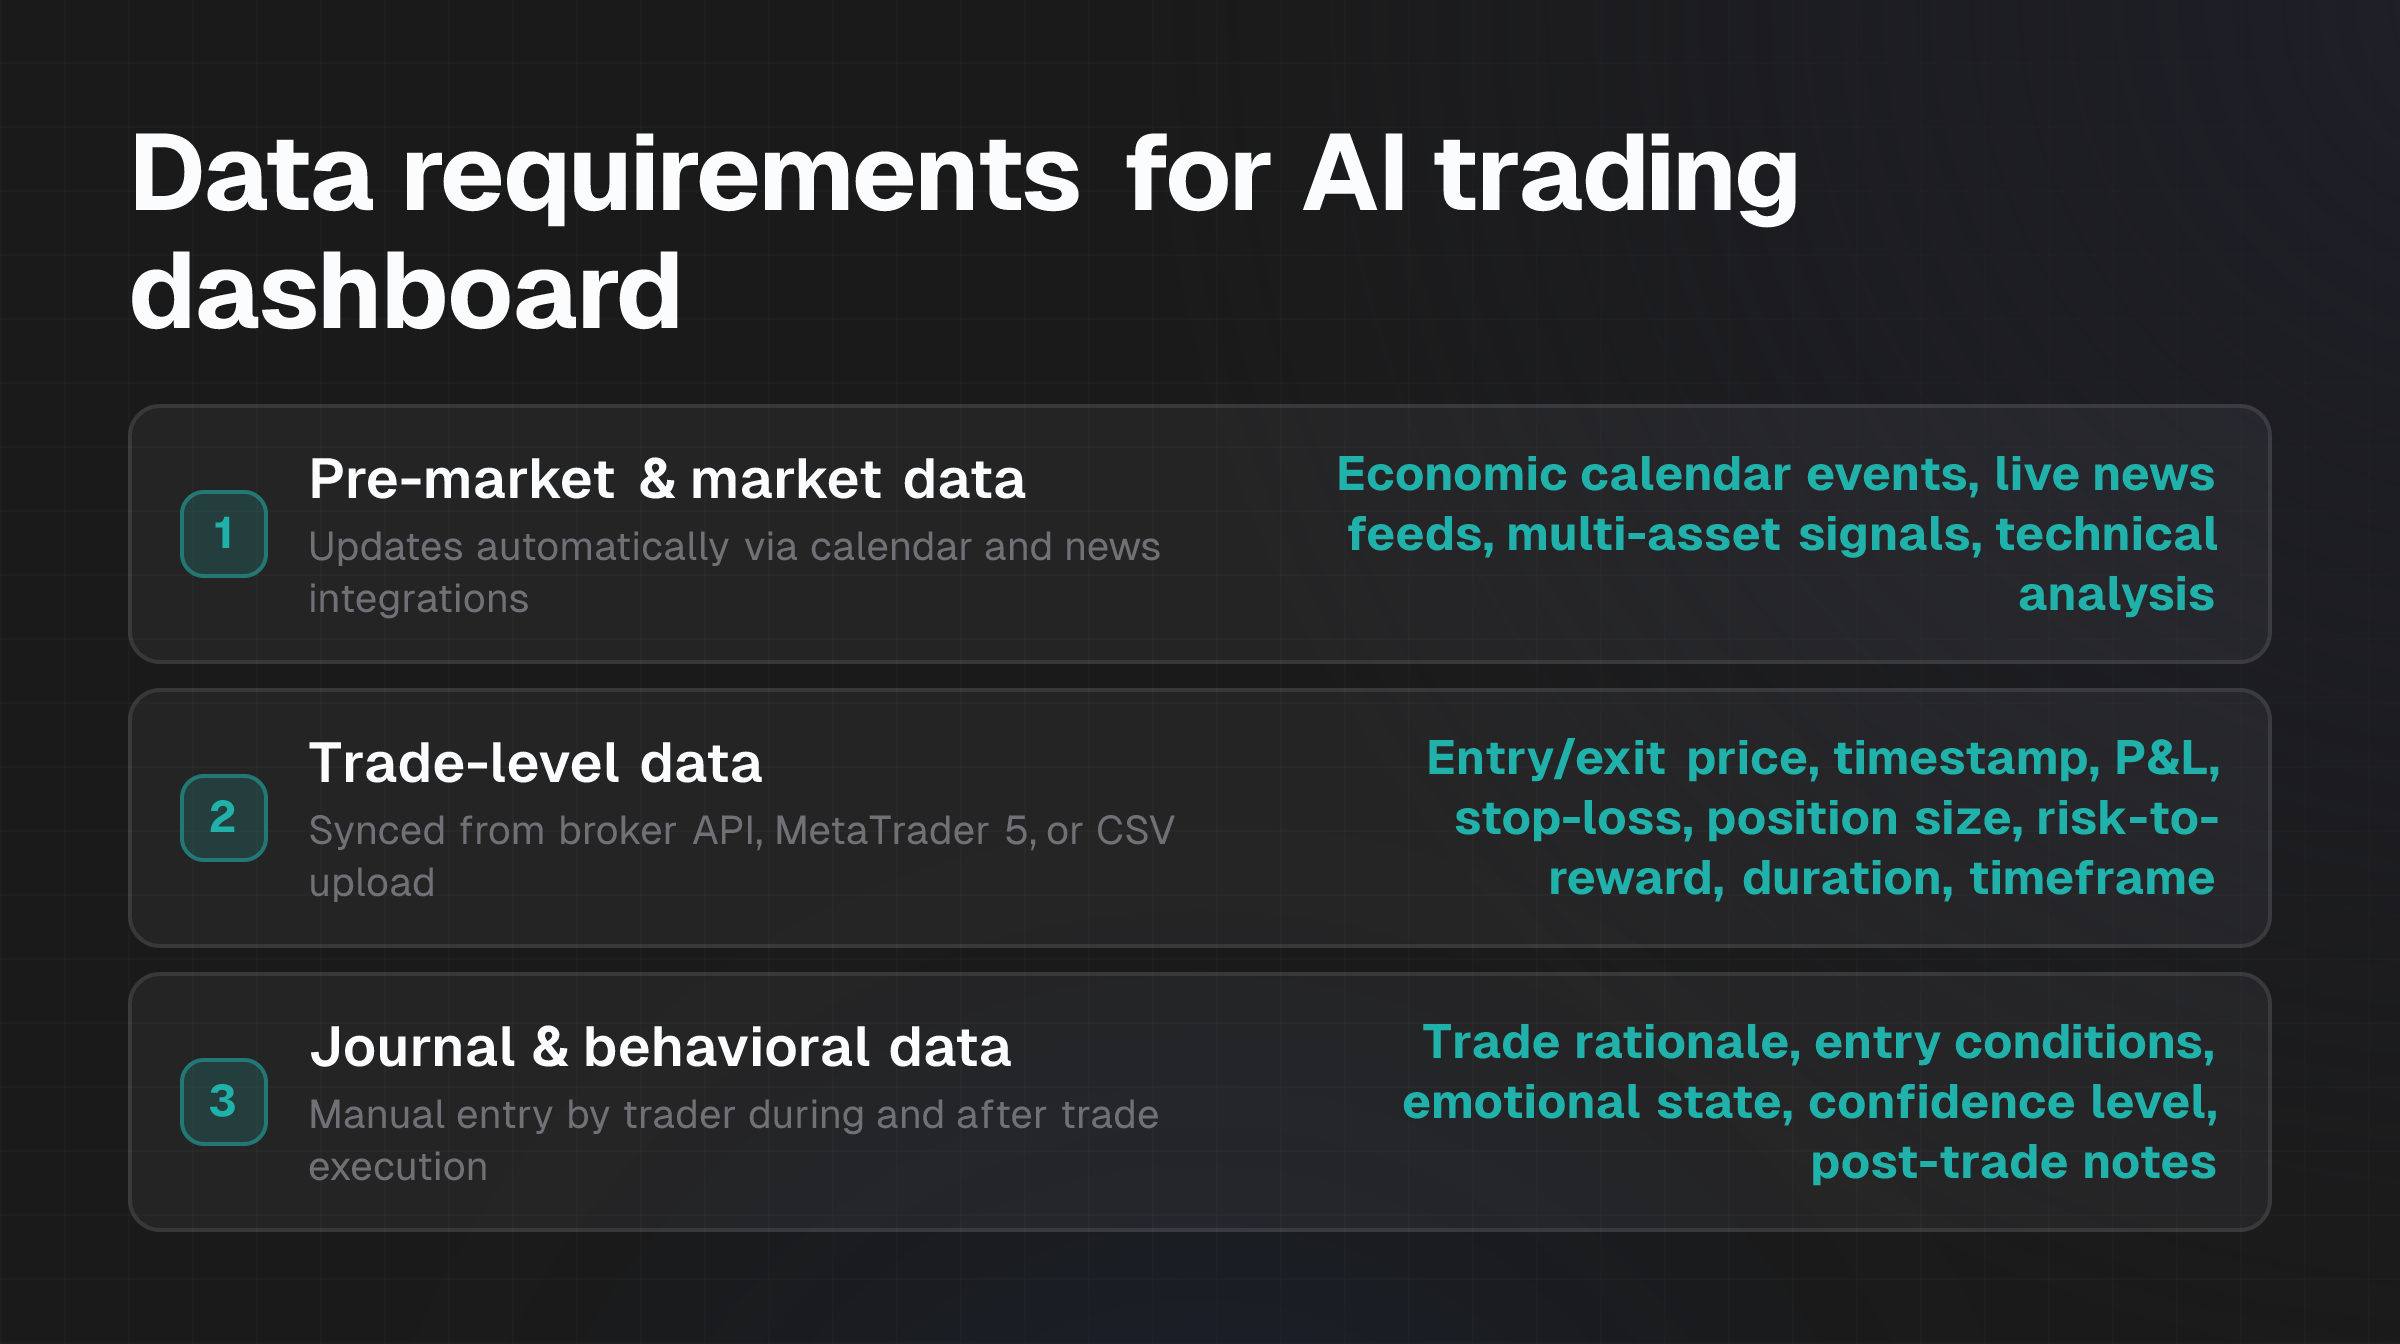
An AI trading dashboard requires three types of data.
Pre-market and market data:
- Economic calendar events, both forecasts and actual releases.
- Live news feeds and sentiment.
- Multi-asset signals across FX, indices, and crypto.
- Daily and weekly market reports and technical analysis.
Trade-level data from your broker or platform:
- Entry price, exit price, and timestamp.
- Profit or loss.
- Risk metrics: stop-loss, position size, risk-to-reward ratio.
- Trade duration and chart timeframe.
Journal and behavioral data:
- Your written trade rationale and entry conditions.
- Emotional state or confidence level at execution.
- Post-trade notes: what worked, what surprised, what you'd change.
The dashboard aggregates these inputs automatically where possible, broker feeds sync via API or MetaTrader 5 integration, economic calendars update in real time, or accepts manual entry via CSV.
Data quality matters. The accuracy of pattern recognition and feedback depends on clean, complete trade records. A missing stop-loss, an incorrect entry time, or skipped trades will affect the insights the dashboard can generate.
How the workflow works
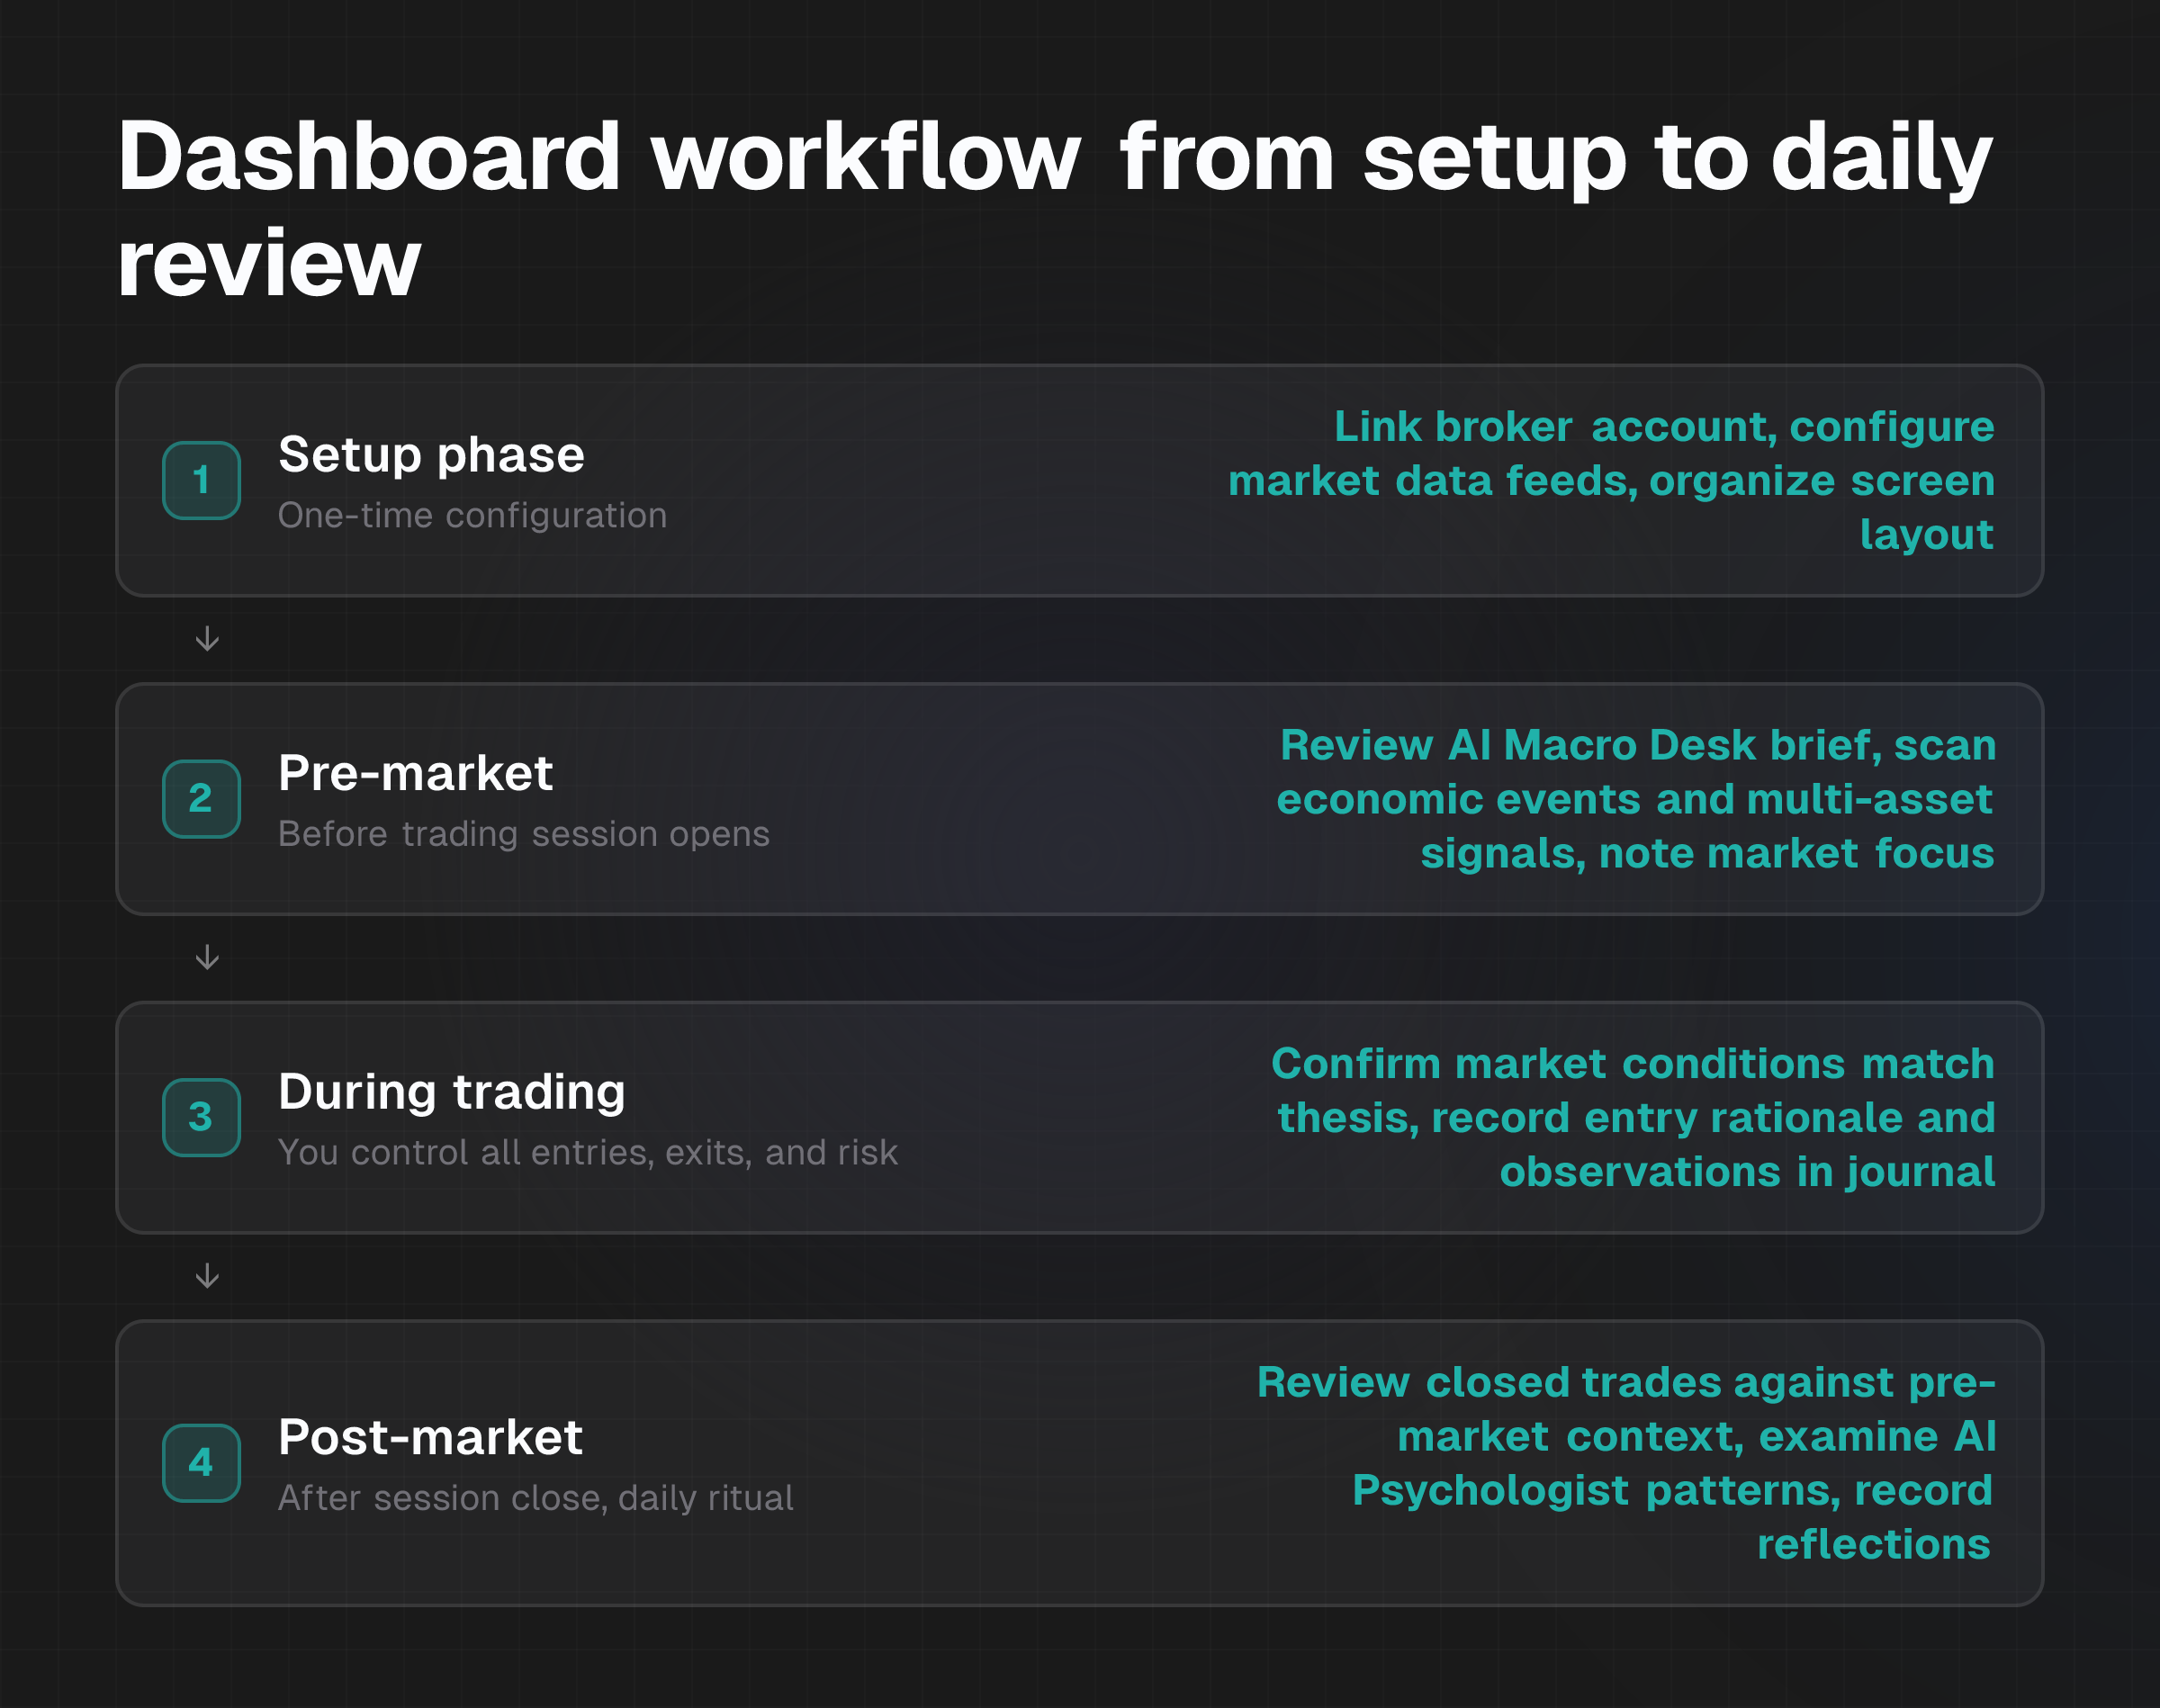
Setup phase:
Link your broker or platform account. Authorize the dashboard to sync trades automatically, or prepare a CSV file of historical trades with correct column headers. The guided upload process recognizes standard formats and skips rows with errors.
Configure market data feeds. Select which economic calendars, news sources, and multi-asset signals appear on your dashboard. Choose whether you want real-time updates or daily summaries.
Organize your screen layout. Arrange sections for pre-market context, live market signals, trade journal, and performance metrics. Prioritize the data you need most often for speed.
Daily use phase:
Pre-market: Open the dashboard and review the AI Macro Desk brief. Scan economic events, news, and multi-asset context for the day. Note which assets or pairs are in focus, what sentiment is, and any divergences across markets.
During trading: Use the dashboard to confirm that market conditions match your pre-market thesis before entering a trade. Record your entry rationale, what you saw, why you entered, what you're watching, directly into the journal. You stay in control of entries, exits, and risk; the dashboard provides market awareness and decision support, not execution signals or trade recommendations.
Post-market: Review closed trades against the pre-market context they occurred in. Did your decision-making shift with volatility? Did news flow change your conviction?
Use the AI Psychologist feedback to identify patterns. Is your risk-per-trade larger when confidence is high? Do you hold winners too long or cut winners short? Do you respect stops consistently?
Compare observed patterns to the underlying recorded trades. Behavioral observations should be checked against the actual trade data, not treated as proof. Record any reflections in the journal for the next review cycle.
Workflow principle: The dashboard transforms review from a once-a-month checkup into a repeatable daily ritual. Pre-market context and trade outcomes sit together, making connections visible and review material ready for deliberate analysis.
What the output means
An AI trading dashboard produces three layers of output.
Market context brief: The AI Macro Desk delivers a summary of macro events, multi-asset signals, and daily sentiment. This is factual: it tells you what happened and what markets are pricing. It's not a forecast or trade signal.
Trade performance metrics: The dashboard calculates win rate, average win, average loss, profit factor, and risk-adjusted returns from your recorded trades. These are descriptive, they show what you did, not what you'll do next. A high win rate in the past doesn't guarantee future profitability. A losing trade can follow a sound process, while a winning trade can result from a poor decision.
Psychological pattern observations: The AI Psychologist identifies correlations in your recorded trades: trades entered when confidence was highest show an average win rate of 55%, while trades entered with low confidence show 42%. Or: you cut losers after 30 minutes 80% of the time, but hold winners for an average of 2 hours.
These observations are associational. A repeated association is evidence worth reviewing, not proof of causation.
Your low-confidence trades may underperform because of poor judgment under doubt, or because those trades typically occurred in choppy, low-volatility sessions where your edge is smaller, or both. The pattern tells you that something was different about those trades; it doesn't tell you why. To understand why, return to the underlying recorded trades, re-read your rationale and market conditions, and form your own judgment.
What it cannot prove
An AI trading dashboard has four material limits.
It can't predict future performance. A pattern observed in your past 100 trades is not a guarantee about your next 10. Market conditions change, your skill improves or deteriorates, and randomness is always present. Neither approach guarantees improved profitability or a higher win rate.
It can't establish causation from correlation. If you notice that your trades entered on low-volume days average a 48% win rate while high-volume days average 55%, the dashboard shows the association. It doesn't prove that volume caused the difference. Your performance on low-volume days might also reflect a different time of day, a different asset class, or a different emotional state. Only by comparing the underlying trades and reasoning through the market conditions can you form a judgment about what actually mattered.
It can't read intent or hidden decision-making. The AI Psychologist works from what you recorded. If you don't journal your emotional state, your conviction level, or your pre-trade expectations, the dashboard can't infer those from the price action alone. The feedback is only as honest as the trade record is complete.
It can't optimize for future markets. Seeing that you made money on mean-reversion trades in 2025 doesn't mean mean-reversion will work in 2026. Market regimes shift. Your edge in one environment can reverse in another. Market context can support review, but it can't make an individual trade predictable.
Privacy, security and user control
An AI trading dashboard requires broker credentials, trade records, and behavioral data, so security matters.
Key safeguards to verify:
Data protection:
- The dashboard connects to your broker via industry-standard API or MetaTrader 5 integration, not by storing your password.
- Trade records are encrypted in transit and at rest.
- Journal entries, your trade rationale and emotional notes, are private within your account.
Trade safety:
- The dashboard watches and syncs trades; it never opens, changes, or closes them. You retain exclusive control of entries, exits, and risk management.
- No automated trade execution or trade signals are issued without your explicit action.
User control:
- You choose which data to share and which integrations to enable.
- You can disconnect your broker account at any time.
- You can export your trade data and journal in standard formats.
Before using any dashboard, verify the privacy policy and terms of service. Confirm that the provider doesn't sell your trade data, doesn't use your trades to train models for other clients, and doesn't claim ownership of your journal. Ask whether the platform is audited for security or holds certifications relevant to your jurisdiction.
Who it may suit
An AI trading dashboard is most useful for traders who:
Trade actively, placing multiple trades per week or more often. Daily setup and review become part of your routine; a one-time dashboard investment pays off.
Need repeatable pre-market preparation. You want to check macro context, news, and multi-asset signals in the same place every session so you don't miss signals and can compare conditions across days.
Review trade decisions deliberately. You journal regularly, record your rationale and emotional state, and want to spot patterns in when your discipline wavers or when market conditions favor or hurt your edge.
Use brokers or platforms that integrate easily. If your broker connects via API or you trade MetaTrader 5, setup is straightforward. If your platform is uncommon, CSV upload works but requires manual export.
Want to consolidate tools. You currently use separate applications for economic calendars, trade journaling, and performance tracking, and you want one unified workspace to reduce switching and speed up review.
A dashboard is less useful if you:
Trade infrequently, a handful of times per month. The effort to learn and maintain the dashboard may not justify the benefit.
Prefer manual, offline journaling or spreadsheets. Some traders find that handwriting trade notes or building custom spreadsheets keeps them more engaged than automated recording.
Trade on platforms with no integration support. CSV import is possible but becomes tedious if you trade dozens of times per day.
Are just starting out and don't yet have a consistent trading process. A dashboard amplifies existing habits; if your process isn't yet repeatable, the dashboard may become a distraction.
The useful question is not which tool sounds most advanced, but which workflow you can maintain consistently. If a dashboard becomes overhead rather than a labor-saving tool, it won't serve you.
Next step
If you trade actively and journal regularly, audit your current setup. Do you review pre-market context and trade outcomes on the same screen, or are they scattered across tabs and applications? How much time do you spend switching between tools?
What data points would make your review faster or deeper?
Explore how other traders organize their dashboards. Review articles on AI Trading Dashboard: Build a Repeatable Pre-Market Routine and How to Find Trading Patterns in Your Journal to see how pre-market context and pattern review fit together.
If you use MetaTrader 5 or a broker that supports standard integrations, test a dashboard trial with a small export of your trade history. The guided setup process usually takes under an hour. Check whether the layout, data feeds, and analytical features match your review habits before committing to a full setup.